
Reminder: As I state in my "Chart Legend" (page tab)
Twitter Warning: I'm pretty liberal with the (twitter) block button, so don't pester me there. I'm not there to pump your position, or to hold your hand, and opinions - unless based in (sound) technical theory - are not appreciated.
I can't tell you how many people I've had to block from my twitter feed, but It's probably in the 100's. The internet is full of trolls, bots, and idiots, and I will err on the side of caution, and block...
Case in point:
The #Nasdaq, and the $SPX has been moving in the same direction for how many weeks now? If you want more explosive moves trade crude oil. pic.twitter.com/7DboaLGj87
— Veteran Market Timer (@3Xtraders) April 7, 2023
If you follow the thread on the above tweet, you'll find this troll first complaining about the lack of direction, and then offering some kind of "wave B" theory, and a chart they obviously found on the internet.
1. The direction is clear, and we got the direction right again on Thursday.
Of course we saw some fools selling in pre-market, but if you took my advice, then you caught another nice little snap-back rally on Thursday!
$SPX Thursday rally - ....as predicted before the opening bell.

Now that I'm trading a leveraged account, I can take advantage of 1 day moves like this, and then get out... ahead of a long weekend; makes trading a lot easier, not having to wait for cash to settle!
What made chasing that trade super-easy was the fact that the $VIX was being hammered to new lows, and that means that there was no fear.
2. Wave B?
Troll replies
"I was more referring to the potential 6 month long abc bearish Elliot wave flat formation than I was to the 12 day rally. I'm talking about B getting taken out to the upside, or a breakout below A."
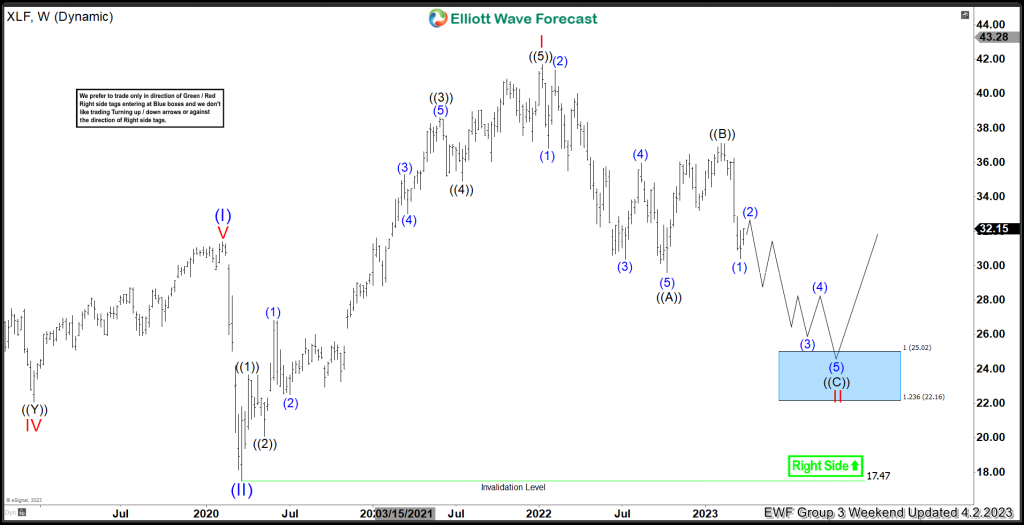
Chart she included - as I later discovered - is from Elliott Wave Forecast, and is only an example of what a standard correction looks like lol

$XLF (Financials EFT) - They apparently believe financials are trading in wave C of Primary wave (5), which I can tell you is probably wrong, and that's coming from someone (me) who proved Robert Prechter wrong in '08.
Note: Remember what I said about the $XLF index just the other day, when I was comparing this crash to the crash of '08.
"Of course many traders like to use the $XLF, but I find it to be less accurate..."
The $XLF isn't as accurate as an index, because ETF charts are constantly rebalanced.
Perhaps this troll was trying to bait me into revealing the Elliott Wave count, because the information she provided made no sense to me, and was obviously plagiarized. Not going to happen.
Could also be that she mistakenly believes that we're in wave b, but I'm just going to chalk this up as troll behavior. That would explain why her twitter account looks fake to begin with.
I'm going to have to come up with a better way to weed out the trolls, but it's just easier to block...
Where are we in the actual Elliott Wave Count?
There are several possibilities for where where we are in the wave count, and I can tell you that it's not wave B, and here's why:
I recently called the false breakout in financials a suspected wave "B", and that turned out to be spot on! This was back in Feb.!
$DJUSFN - Financials - obvious head-fake wave B. Either primary wave b, or a minor wave b.

$NYA - $NYSE composite traded into the same false breakout, and now a bearish H&S pattern btw

Of course the $SPX chart looks a little different, because the $SPX is continuously rigged.
$SPX chart from the public charts area - trading at and even above the right shoulder.

I can't say if the 4150 target will be taken out this week, or not, but considering the fact that the $VIX continues to be unmercifully hammered, I don't see why not.
Granted, investors have become complacent, but many investors aren't even trading this week.
Light holiday volume continues
The whole point of driving the market higher, is in order to sell the options market, ahead of the next correction.
They are holding the market up, in order to crash it at the appropriate time.
That could be as soon as the 17th, when most traders are back from vacation, but OPEX is Friday. I believe Thursday is the day after Passover, so either the market continues to be held up going into April OPEX, or it's taken down....
I'm already looking out to May, which is typically selling season, and even if we get a sharp correction in April, I think we're still not going to see much selling until we get closer to Memorial Day.
Short term
Nothing has changed since Thursdays trading session
$SPX - Thursday's chart - updated

Take Care,
AA
No comments:
Post a Comment