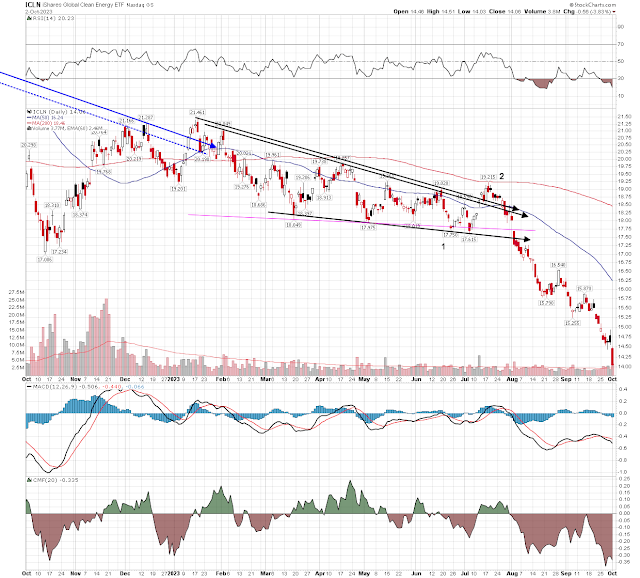
I haven't touched on Elliott Wave theory for a while; I've been wanting to cover triangle patterns for years, and this looks like an opportune time, since we have several markets which have recently traded into apparent triangle patterns. I say "apparent...", because many times you'll see what looks like a triangle pattern, but then it turns out to be a channel, or something else. This is just one of the things that makes triangle patterns so tricky.
For the most part I'd like to try to identify the patterns themselves, rather than trying to determine which wave a certain pattern is trading in. That's rudimentary; you should already know - for example - that a leading triangle usually occurs in wave 1 (or A), or that sideways consolidation in a triangle may point to a wave 4, or complicated combination pattern.
If you don't know basic Elliott Wave Theory, you may still get something out of this study, as many triangle patterns are called by other names which you may recognize, such as a "down-turned wedge", or a Pennant pattern, or even bull/bear flags.
Different types of triangles:
1. Leading diagonal triangles, and I'm going to include continuation patterns, in this group.
2. Consolidation Triangles - upward/ downward, sideways (expanding, or contracting), and I'm going to include pennant patterns in this group. This can also be called a range, and contracting patterns are far more common than expanding (broadening) patterns.
3. Ending diagonal triangles are topping patterns, usually found in wave 5. I see many markets, and stocks, currently trading into this type of pattern, so I know the end is coming soon, or within a few years anyhow.
4. Broadening top, or megaphone top, is one of my favorite types of triangles. Can also be referred to as an expanding triangle top. They take a long time to complete, but once it's finished, the resulting decline is often tremendous. This is the type of top we saw in Germany, just before the covid crash.
Some technicians don't even point to triangle patterns, because they either aren't looking for them, or they don't trust them. Other times I see technicians pointing to triangles where there is none.
I used to be guilty of the same thing. I like broadening tops, so I'm always looking for them, and that sometimes gets me into trouble.
In order to avoid this, you may want to limit triangle identification to patterns that have nearly completed, until you become more experienced...
Leading Diagonal Triangle Pattern
A good example of a downturned LDT pattern would be on the gold chart I was pointing to a few weeks ago:
$GLD - traded into a down-turned triangle pattern. Falls out of the bottom of the triangle. This is typical.
I'm not going to predict what gold does next, and I can't even say whether, or not, the triangle is still in play, but it's a good example of a downturned triangle pattern that worked.$DJUSTC (Dow Tech) - For Example
Sideways Consolidation in a Triangle
One Example that comes to mind is the broadening sideways pattern we've seen the Hang Seng trade into over the past 5 months.
$HSI (Hong Kong Hang Seng) - looks like a broadening sideways range - probably in wave B.
A good example of a contracting sideways pattern can be found on the Russell 2000
$IYM - Russell 2000
A good example of a upturned triangle in a bearish wave B, would be in consumer staples
$XLP
Of course you can see the same pattern occur in a bull market, where wave "B" looks like a pullback in a triangle, although I find that's pretty rare.
Ending Diagonal Triangles
I have many real-time examples of overbought stocks, trading into ending diagonal triangles, I can't give away, but one of the best examples of one of these was seen in a setup for the infamous volmageddon trade.
$SVXY - see the blue contracting triangle, followed by the crash.
Broadening Top, or Megaphone Top
One of the best examples of one of a broadening top, as I mentioned above, was the one on the $DAX, which I used to predict the 2020 crash.
$DAX - The Climax of The Broadening Top 2020
Copyright 2023 3XTraders
Take care,
AA


No comments:
Post a Comment