Yesterday the dash for trash continued with $SOFI driven into a short squeeze - up 20%, and ROKU up another 7%.
China was also up, and after doing a little charting of Chinese stocks, all I could do was try to warn the below average investor, and shake my head.
Don't be fooled by the trolls pushing Chinese stocks. China is in deep trouble, and talk of more stimulus is BS #FinTwit #China #Stocks pic.twitter.com/8UDkDjsh5P
— Veteran Market Timer (@3Xtraders) July 31, 2023
I liked $BABA back in July, but not so much as it trades into the top of the range.
The broader market, including the largest sector making up the broader market (tech stocks).
Do investors realize that we have not seen a market correction in nearly 5 months, or are they too busy selling volatility to notice..?
Meanwhile: $SPX futures continue to be bought at the 4600 level.
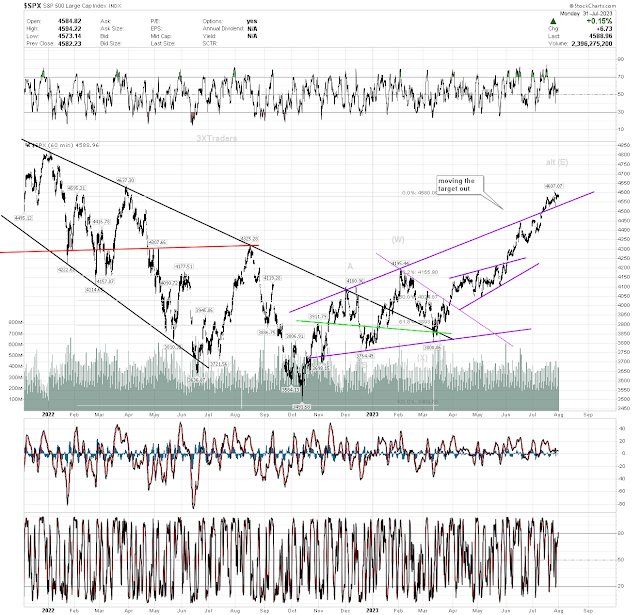
Yesterday I pointed to some 60 min. charts, and this morning I have another one to show you.
$SPX (60 min. view). If you recall - back in Feb - I was bullish and calling for a rally to the top of the broadening triangle (aka mega phone) pattern seen below (in purple). Then I believe it was some time in May, when I moved the target out past May.
Now here we are in August. We've since overshot that target by around 100 handles, and now the smart money is unloading their shares. This is a process that takes longer than you might think, and this is why they drive the price action above the top of the pattern - so they can take their time....
You decide how long this topping process is going to take, but have no doubt; they will pull the rug at the appropriate time, and start taking out critical moving averages - in order to trigger program selling - just as they drove the price action above the moving averages, on the way up.
I for one am at the point that I'm ready to start shopping trading programs, which alert to crossovers in different sectors, as I believe this is going to be the best strategy moving forward.
I'll let you know when I find one!
Until then take care,
AA


No comments:
Post a Comment